Популярное
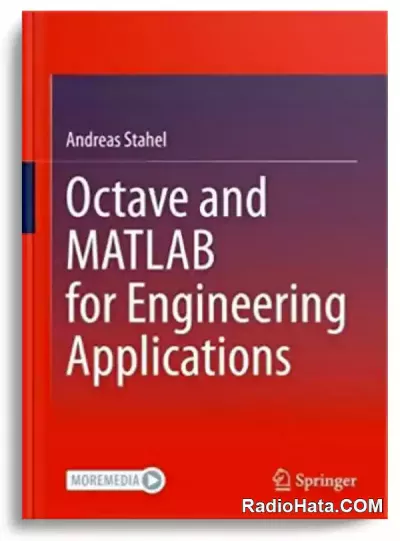
Octave and MATLAB for Engineering Applications
For many engineering tasks extensive computations or visualizations are required. The well established Matlab and Octave (a very similar open source software) are excellent tools for modeling, computing and visualization. This book will help the reader to acquire basic knowledge and elementary programming skills with Octave/Matlab.
The Target Groups
Students in electrical and mechanical engineering and engineering fields in general Working engineers
Contents
1. Introduction to Octave/MATLAB
1.1 Starting up Octave or MATLAB and First Steps
1.1.1 Starting up Octave
1.1.2 Packages for Octave
1.1.3 Information about the operating system and the version of Octave
1.1.4 Starting up MATLAB
1.1.5 Calling the operating system and using basic Unix commands
1.1.6 How to find out whether you are working with MATLAB or Octave
1.1.7 Where and how to get help
1.1.8 Vectors and matrices
1.1.9 Broadcasting
1.1.10 Timing of code and using a profiler
1.1.11 Debugging your code
1.1.12 Command line, script files and function files
1.1.13 Local and global variables, nested functions
1.1.14 Very elementary graphics
1.1.15 A breaking needle ploblem
1.2 Programming with Octave
1.2.1 Displaying results and commenting code
1.2.2 Basic data types
1.2.3 Structured data types and arrays of matrices
1.2.4 Built-in functions
1.2.5 Working with source code
1.2.6 Loops and other control statements
1.2.7 Conditions and selecting elements
1.2.8 Reading from and writing data to files
1.3 Solving Equations
1.3.1 Systems of linear equations
1.3.2 Zeros of polynomials
1.3.3 Nonlinear equations
1.3.4 Optimization
1.4 Basic Graphics
1.4.1 2-D plots
1.4.2 Printing figures to files
1.4.3 Generating histograms
1.4.4 Generating 3-D graphics
1.4.5 Generating vector fields
1.5 Basic Image Processing
1.5.1 First steps with images
1.5.2 Image processing and vectorization, edge detection
1.6 Ordinary Differential Equations
1.6.1 Using C++ code to speed up computations
1.6.2 ODE solvers in MATLAB/Octave
1.6.3 The command lsode( ) in Octave
1.6.4 Codes with fixed step size, Runge–Kutta, Heun, Euler
1.6.5 List of files
2. Elementary Statistics With Octave/MATLAB
2.1 Introduction
2.2 Commands to Load Data from Files
2.3 Commands to Generate Graphics used in Statistics
2.3.1 Histograms
2.3.2 Bar diagrams and pie charts
2.3.3 More plots
2.4 Data Reduction Commands
2.4.1 Basic data reduction commands
2.4.2 Data reduction commands for pairs of vectors
2.4.3 Data reduction commands for matrices
2.5 Performing Linear Regression
2.5.1 Using the command LinearRegression( )
2.5.2 Using the command regress( )
2.5.3 Using the commands lscov( ), polyfit( ) or ols( )
2.6 Generating Random Numbers
2.7 Commands to Work with Probability Distributions
2.7.1 Discrete distributions
2.7.2 Continuous distributions
2.8 Commands for Confidence Intervals and Hypothesis Testing
2.8.1 Confidence intervals
2.8.2 Hypothesis testing, p–value
2.9 List of Files for Statistics
3. Engineering Applications
3.1 Numerical Integration and Magnetic Fields
3.1.1 Basic integration methods if data points are given
3.1.2 Basic integration methods for given functions
3.1.3 Integration over domains in R
3.1.4 From Biot–Savart to magnetic fields
3.1.5 Field along the central axis and the Helmholtz configuration
3.1.6 Field in the plane of the conductor
3.1.7 Field in the xz–plane
3.1.8 The Helmholtz configuration
3.1.9 List of codes and data files
3.2 Linear and Nonlinear Regression
3.2.2 General linear regression, matrix notation
3.2.3 Estimation of the variance of parameters, confidence intervals
3.2.4 Estimation of variance of the dependent variable
3.2.5 An elementary example
3.2.6 Example 1: Intensity of light of an LED depending on the angle of observation
3.2.7 QR factorization and linear regression
3.2.8 Weighted linear regression
3.2.9 More commands for regression with Octave or MATLAB
3.2.10 Code for the function LinearRegression( )
3.2.11 Example 2: Performance of a linear motor
3.2.12 Example 3: Calibration of an orientation sensor
3.2.13 Example 4: Analysis of a sphere using an AFM
3.2.14 Example 5: A force sensor with two springs
3.2.15 Nonlinear regression, introduction and a first example
3.2.16 Nonlinear regression with a logistic function
3.2.17 Nonlinear regression with an arctan runction
3.2.18 Approximation by a Tikhonov regularization
3.2.19 A real world nonlinear regression problem
3.2.20 The functions lsqcurvefit and lsqnonlin
3.2.21 List of codes and data files
3.3 Regression with Constraints
3.3.1 Example 1: Geometric line fit
3.3.2 An algorithm for minimization problems with constraints
3.3.3 Example 1: continued
3.3.4 Detect the best plane through a cloud of points
3.3.5 Identification of a straight line in a digital image
3.3.6 Example 2: Fit an ellipse through some given points in the plane
3.3.7 List of codes and data files
3.4 Computing Angles on an Embedded Device
3.4.1 Arithmetic operations on a micro controller
3.4.2 Computing the angle based on coordinate information
3.4.3 Error analysis of arctan–function
3.4.4 Reliable evaluation of the arctan–function
3.4.5 Implementations of the arctan–function on micro controllers
3.4.6 Chebyshev approximations
3.4.7 List of codes and data files
3.5 Analysis of Stock Performance, Value of a Stock Option
3.5.1 Reading the data from the file, using dlmread( )
3.5.2 Reading the data from the file, using formatted reading
3.5.3 Analysis of the data
3.5.4 A Monte Carlo simulation
3.5.5 Value of a stock option : Black–Scholes–Merton
3.5.6 List of codes and data files
3.6 Motion Analysis of a Circular Disk
3.6.1 Description of problem
3.6.2 Reading the data
3.6.3 Creation of movie
3.6.4 Decompose the motion into displacement and deformation
3.6.5 List of codes and data files
3.7 Analysis of a Vibrating Cord
3.7.1 Design of the basic algorithm
3.7.2 Analyzing one data set
3.7.3 Analyzing multiple data sets
3.7.4 Calibration of the device
3.7.5 List of codes and data files
3.8 An Example for Fourier Series
3.8.1 Reading the data
3.8.2 Further information
3.8.3 Using FFT, Fast Fourier Transform
3.8.4 Moving spectrum
3.8.5 Determine the transfer function
3.8.6 List of codes and data files
3.9 Grabbing Data from the Screen and Spline Interpolation
3.9.1 Reading from an Octave/MATLAB graphics window by ginput( )
3.9.2 Create xinput( ) to replace ginput( )
3.9.3 Reading an LED data sheet with Octave
3.9.4 Interpolation of data points
3.9.5 List of codes and data files
3.10 Intersection of Circles and Spheres, GPS
3.10.1 Intersection of two circles
3.10.2 A function to determine the intersection points of two circles
3.10.3 Intersection of three spheres
3.10.4 Intersection of multiple circles
3.10.5 Intersection of multiple spheres
3.10.6 GPS
3.10.7 List of codes and data files
3.11 Scanning a 3–D Object with a Laser
3.11.1 Reading the data
3.11.2 Display on a regular mesh
3.11.3 Rescan from a different direction and rotate the second result onto the first result
3.11.4 List of codes and data files
3.12 Transfer Functions, Bode and Nyquist plots
3.12.1 Create Bode and Nyquist plots, raw MATLAB/Octave Code
3.12.2 Create Bode and Nyquist plots, using the MATLAB–toolbox
3.12.3 Create Bode and Nyquist plots, using Octave commands
3.12.4 Some commands for control theory
Title: Octave and MATLAB for Engineering Applications
Author: Andreas Stahel
Year: 2022
Publisher: Springer
Language: English
Format: PDF
Pages: 425
Size: 10.22 Mb
Download Andreas Stahel. Octave and MATLAB for Engineering Applications
~ Turbobit
Похожие новости
Информация
Посетители, находящиеся в группе Гости, не могут оставлять комментарии к данной публикации.
-
Зарубежные журналы
-
Радиотехнические журналы
-
Книги


